





























Healthcare Revenue Cycle Metrics: Denials and A/R Explained
Revenue cycle management, or RCM, covers the financial process that moves a patient account from registration to payment. Healthcare revenue cycle metrics show where that process starts to slow down or lose value.
Two measures can reveal different parts of the problem. The denial rate shows how often claims fail during payer adjudication. Days in accounts receivable (A/R) show how long billed revenue remains unpaid.
Neither measure tells the full story alone. A denial rate of 5 percent may look manageable. That view can change when high value procedures account for most denied dollars. The same issue applies to accounts receivable. An average of 38 days may look stable while more balances move beyond 90 days.
The useful question is not simply how much the metric changed. The real question is where the change occurred and what caused it.
Why Healthcare Revenue Cycle Metrics Matter
Cash collections can be steady despite issues in the revenue cycle process. A medical group may collect a similar amount each month. Whereas its billing staff may spend more time solving claims or aging receivables.
The distinction is important. An increase in the denial rate could mean there is a problem with how patients are being authorized or checked for eligibility. On the other hand, a rise in accounts receivable days might suggest that payers are taking longer to respond.
An overall denial rate of 5 percent says little without more context. One payer may account for a large share of denied dollars. One specialty may create most of the increase. A specific denial reason may appear across several locations. The overall metric gives the first signal, while a segmentation shows where the problem sits.
Read Denials and A/R as Connected Signals
The relationship between denial rate and accounts receivable days can narrow the investigation. If both the denial rate and accounts receivable days go up, it could mean denied claims are not being resolved quickly and are staying open for periods. The team should look closely at denied dollars, how long it takes to resolve claims, and payer-specific aging reports.
If denial rate rises while accounts receivable days stay stable, then denial resolution may still be working well. The increase may also come from lower value claims that have little effect on total receivables.
If denial rate stays the same while accounts receivable days go up, then denials might not be the issue. The review can shift to payer turnaround and healthcare payment processing to check for delays in posting or reconciliation.
If both the denial rate and accounts receivable days stay steady but older A/R keeps growing, that could mean the averages are hiding a backlog. The team can check how these patterns show up by payer or specialty, and dollar value. A payer that shows up in both denial data and older accounts receivable should get attention.
The goal isn’t to push every number down. It’s about understanding what’s really going on.
How to Calculate Healthcare Denial Rate
A denial rate needs a clear numerator and denominator before the result can support a useful decision. The first step is to decide what the organization wants to measure. A claim count rate measures frequency. A dollar rate measures financial exposure. Those figures can tell very different stories.
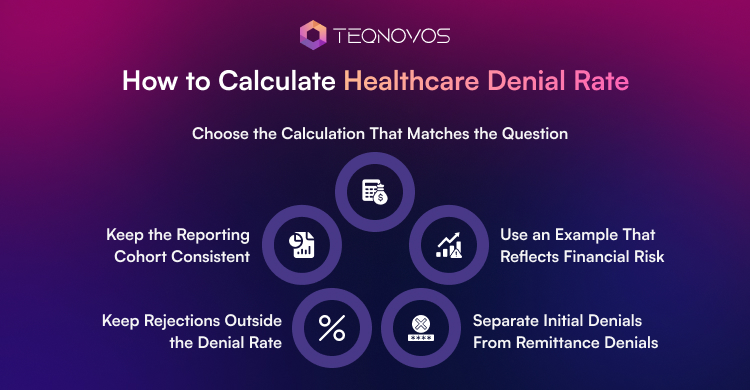
Choose the Calculation That Matches the Question
Initial denial rate by claim count
Unique claims denied on first adjudication ÷ total claims submitted × 100
This calculation shows how often submitted claims receive an initial denial.
Initial denial rate by dollars
Gross charges tied to initially denied claims ÷ gross charges submitted × 100
This calculation shows how much submitted charge value is linked to initially denied claims.
The difference matters.
A medical group may have many denied claims with a small financial effect. Another group may have fewer denials but much more revenue at risk because those denials involve costly services. A useful review looks at both claim frequency and denied value.
Use an Example That Reflects Financial Risk
Consider a medical group that submits 10000 claims during one reporting period. Its initial denial rate goes up from 4.2 percent to 5.1 percent. That increase may look small at first. But the financial impact depends on the claims behind it.
A rise driven by routine office visits may have a limited effect on revenue. A rise tied to imaging or surgery may create much greater financial exposure. The next step is not simply to report the new percentage.
The team can break the increase down by payer and claim value. That review shows where the increase actually comes from.
Separate Initial Denials From Remittance Denials
The Healthcare Financial Management Association, or HFMA, uses standardized measures to separate different stages of the denial process. An initial denial rate counts the first denial for each claim. Several denial codes on the same claim still represent one initially denied claim. The HFMA measure also excludes rebills.
A remittance denial rate uses a different calculation.
Claims denied on remittance ÷ total claims remitted × 100
This measure can include an initial denial or a denial after appeal. It can also include a zero payment or partial payment remittance with a denial indicator. The two measures describe different claim groups.
A dashboard that changes between these definitions can create a false trend. The denial type needs a clear label in every reporting period.
Keep Rejections Outside the Denial Rate
A rejected claim can fail before payer adjudication. That difference changes where the team needs to investigate. A rejection may result from missing claim data or another submission problem. A denial happens after the payer evaluates the claim and decides not to pay some or all of it. Combining both issues weakens the analysis.
A rise in rejections points the review toward claim submission and data quality. A rise in adjudicated denials moves the review toward authorization and coding and payer rules and medical necessity.
Keep the Reporting Cohort Consistent
Timing can change the denial rate in healthcare even when claim performance stays the same. A claim submitted near the end of a month may receive a payer decision in the next month. Problems appear when the report compares claims submitted in one period with denials received in another period.
The numerator and denominator may then represent different claim groups. A defined cohort prevents that mismatch.
The report needs a clear rule for when a claim enters the denominator. It also needs a rule for when the related denial enters the numerator.
What Days in A/R Reveals
Days in accounts receivable shows how long money that has been billed stays unpaid. This metric is helpful when the company looks past the number.
A result of 40 days does not tell where the delay began. It does not show which payer is holding the balance. It also does not reveal how much revenue has moved into older accounts. The number gives the signal. The underlying receivable data gives the explanation.
Use One Calculation Method
The Healthcare Financial Management Association defines net days in accounts receivable with this formula:
Net accounts receivable ÷ average daily net patient service revenue
Net accounts receivable represents the receivable balance after the defined adjustments used by the organization. A team may use net patient service revenue while another team uses average daily charges. However, the methods do not produce directly comparable results.
A lower result may come from a new calculation basis rather than faster collections. The report therefore needs to use the same method each time.
Read A/R Aging Beside the Average
Net days in accounts receivable compresses the full receivable balance into one number. That can hide an aging problem. A medical group may report 38 net days in accounts receivable for two consecutive months. The result appears stable. Yet the share of accounts older than 90 days may rise during the same period.
The average has not changed. The collection risk has. Accounts receivable aging shows where balances sit across age groups. Accounts receivable aging helps reveal when unpaid revenue starts moving into categories. Additionally, A/R aging becomes more useful when accounts receivable aging is segmented by payer and claim type.
If one payer accounts for most balances beyond 90 days, then the issue may involve payer processing or follow up. If older balances appear across several payers, then the problem may sit deeper in the collection workflow.
Investigate What Changed Inside the Balance
A rise in days in accounts receivable does not always mean collections became slower. Credit balances can change the reported receivable amount. Patient payment plans can keep balances open for periods.
How Denial Rate and A/R Days Work Together
The relationship between denial rate and days in accounts receivable can help an RCM team decide where to focus their investigation. When denial patterns start to change, the questions the team asks should also change. It’s important to watch how denials add up over time and how long claims remain in accounts receivable. This helps the team target the real issues.
| Trend | What it suggests | What to check |
| Denial rate rises and accounts receivable days rise | Denied claims may be remaining unresolved for longer and adding to outstanding balances. | Check denial aging and average resolution time. Review whether high-value denied claims are staying open longer than usual. |
| Denial rate rises while accounts receivable days stay flat or fall | Higher denial volume may not be increasing total receivables. Strong recovery activity could be offsetting the increase. Write offs could also reduce reported accounts receivable. | Check appeal turnaround and recovered denial value. Review denial write-offs to see whether balances were collected or removed. |
| Denial rate stays stable or falls while accounts receivable days rise | The collection slowdown may sit outside denial activity. | Check payer payment turnaround and unresolved clean claims. Review whether balances are aging while denial volume remains controlled. |
| Both measures fall | Claim outcomes and collection timing may be improving at the same time. | Check cash collected from older accounts. Review whether fewer balances are moving into later aging categories. |
The table provides diagnostic questions. It does not prove what caused the movement.
Use the Pattern to Direct the Investigation
Think about a healthcare provider organization where the denial rate goes up during one quarter while accounts receivable days go down. This leads to a specific question. Is recovery activity absorbing the increase in denied claims?
The RCM team can review how quickly denied claims move from initial denial to correction or appeal. It can also compare denied dollars with recovered dollars. If recovery remains strong, then the higher denial volume may have limited effect on overall receivables.
A different finding changes the interpretation. If denial write offs rise during the same period, then lower accounts receivable may not reflect stronger collections. The receivable balance may have fallen because more denied revenue was removed from active collection.
This is where denial management metrics add value. Resolution time and write off activity can show what happened after the initial denial. The same approach applies to other movement patterns.
How Leaders Can Turn the Findings Into Action

When the analysis identifies a weakness in the revenue cycle, the next step is to act.
Set the Review Cadence Around Workflow Speed
Review frequency should match how fast the process can change. Authorization denials might need to be checked every week because new issues can show up fast. Payer accounts receivable might need a longer time frame because it takes more time to collect money.
Cadence must match the pace of the work that is being corrected. If it does not match the pace, it can cause confusion. However, the point here is not about increasing reporting. It is about spotting problems early.
Assign Ownership to the Function That Can Change the Outcome
Ownership needs to follow the source of the breakdown. Eligibility errors belong with registration operations. Coding patterns belong with coding or documentation functions. Authorization denials may require utilization management or payer relations. Payment posting delays belong with the posting workflow.
The operational owner does not need to be the function that first discovered the pattern. That distinction matters. Discovery and correction often happen in different parts of the revenue cycle.
Prioritize by Financial Exposure and Recoverability
Volume alone is a weak basis for prioritization. A denial category with fewer claims may deserve faster attention if it carries more denied dollars. An aging bucket with older balances may also need priority when recovery options are narrowing.
Denial management metrics can support that decision. Compare denied value with account age and recovery potential before assigning work. This keeps staff effort focused on revenue that still has a realistic path to collection.
Measure the Outcome Rather Than the Completed Task
A completed workflow change does not prove improvement. Success needs to appear in the relevant revenue cycle KPIs.
An authorization process change can be tracked through the related denial category. A payer follow up change can be checked against unresolved balances and aging movement. A posting change can be checked against posting lag. The management sequence becomes specific to RCM work:
Signal → Workflow source → Operational owner → Financial priority → Measured outcome
That sequence turns analysis into a controlled response rather than another reporting exercise.
Final Thoughts
Revenue cycle metrics become useful when they guide the next operational decision. A rising denial rate needs a different response than slower accounts receivable growth. The same applies when both measures move in opposite directions. The strongest analysis connects the trend with denied dollars and aging movement and recovery activity.